How Historigraph works
A historigraph helps you understand history the way a map helps you understand geography. It is a map of time.
To understand the historigraph, you can compare it to other ways of visualizing change over time.
There are a number of ways you can visualize history, meaning the change in space over time, but none of them work very well.
They each have their own limitations.
A timeline
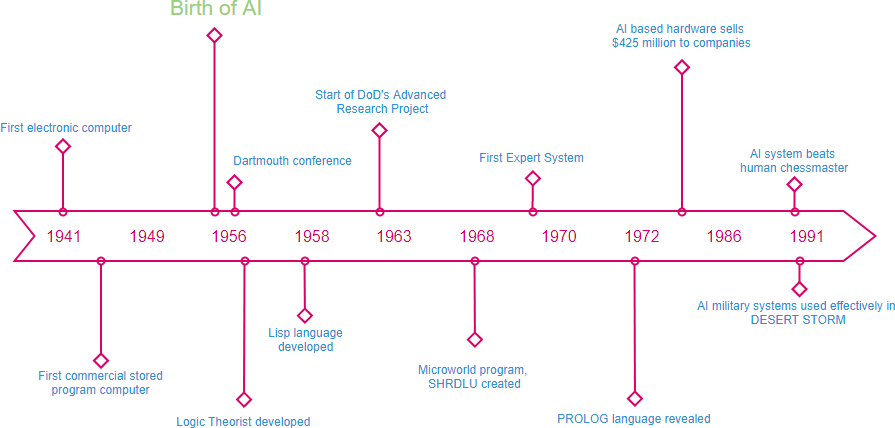
Timelines frame history as a series of arbitrarily selected anecdotes whose relationships to one another must be inferred. They are only slightly better than a block of text at helping you understand how the world changed over time.
You also cannot zoom out very far to get the bigger picture because a timeline depends on readable text. To cover a long enough period in sufficient detail while keeping it all within your field of vision, the text would eventually have to become too small to read.
A line graph
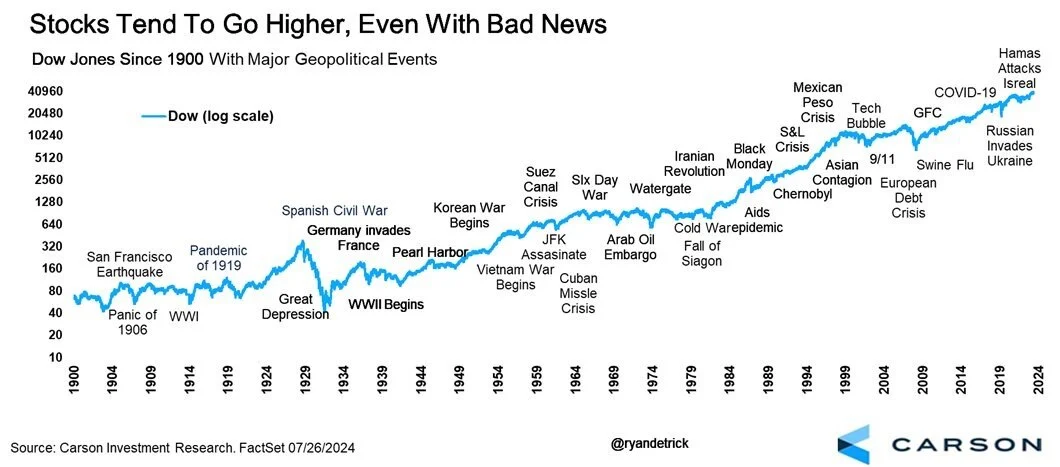
A line graph is great for showing change in a single variable over time. But history is not a single variable. History is innumerable variables acting together and influencing one another.
You can show a few variables on the same graph. Add many more, and the graph quickly becomes visual chaos.
An animated map
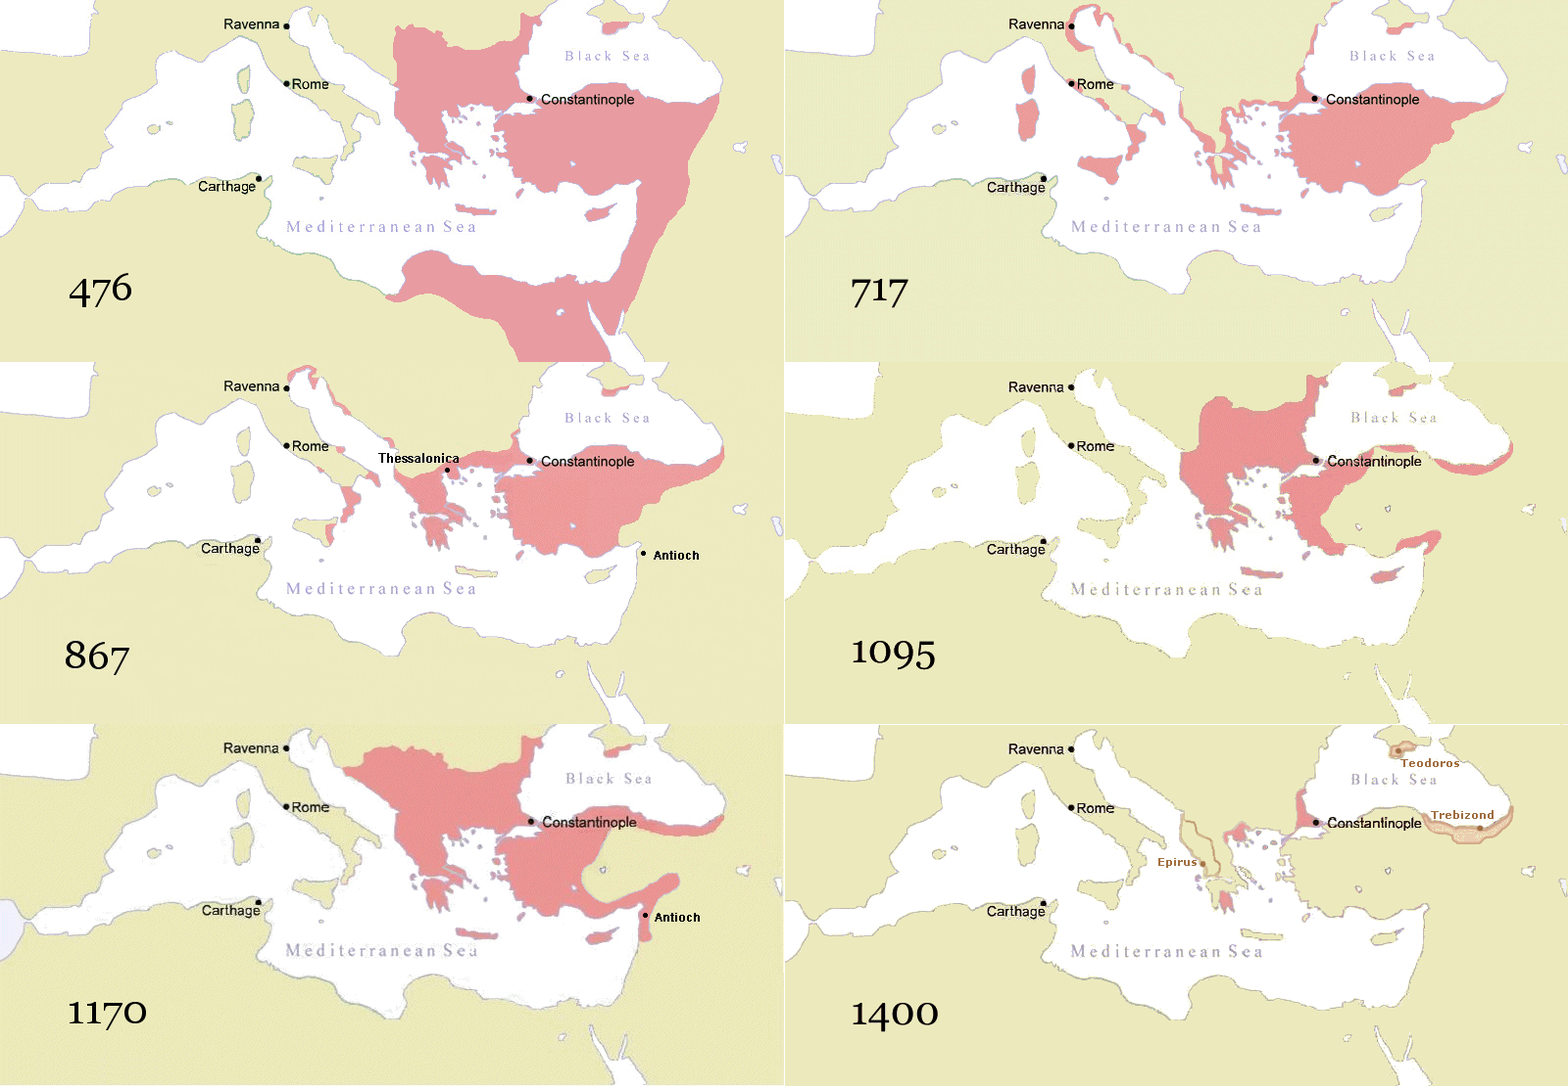
A map conveys the state of the world at a particular moment. It captures a snapshot of complexity, but not the changes in that complexity that define history.
Animating the map adds time, but introduces another problem: your brain has a limited capacity to remember what it has just seen. Even comparing two moments means remembering what changed at every location between one frame and the next.
A series of maps
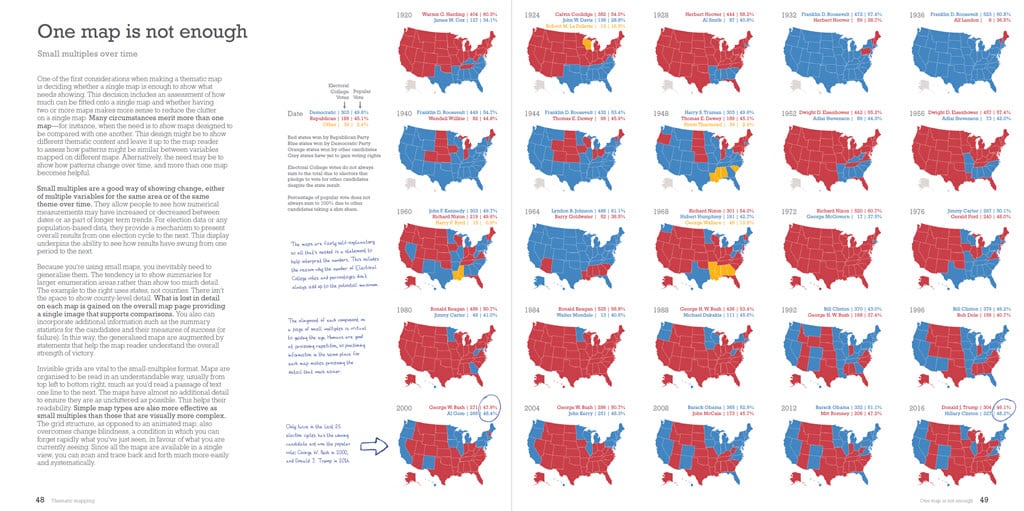
Displaying multiple versions of the same map at once lets you compare several snapshots in time and see how the world changed between them.
But you still have to repeatedly locate the same place across multiple maps. That consumes mental effort and limits how many places and moments you can compare at once.
In order to depict history in all its complexity, a purpose-built visualization is necessary. See how it is made.